
Prometheus とは、メトリクスベースのモニタリング (監視) システムです。

初めに
本記事は以下の書籍を参考に執筆しています。
本記事ではコンテナ環境構築シリーズの Prometheus 編となります。
他のシリーズについては、以下の記事をご覧ください。
モニタリング
モニタリングの目的
モニタリングの目的は、主に次の3つです。
- アラート:システムの問題を通知
- デバッグ情報の提供:システムの問題の原因を調査するための情報
- トレンド調査:システムの変化 (ハードウェアのスペックの決定などに利用)
モニタリング (監視) の種類
モニタリングの種類を紹介する前に、これから説明に使う言葉の意味を紹介します。
- イベント:監視対象 (HTTP リクエスト、関数等)
- コンテキスト:イベントの要素 ([URL、Cookie、IP アドレス]、[コールスタック] 等)
モニタリングの種類には、主に次の4種類が存在します。
| モニタリングの種類 | 説明 | 具体例 |
|---|---|---|
| プロファイリング | 原因が特定可能なイベントのコンテキストを記録 | tcpdump |
| トレーシング | 対象とするイベントの前後のイベントの流れを記録 | スタックトレース HTTP トレース |
| ロギング | 対象とするイベントのコンテキストの一部を記録 | リクエストログ トランザクションログ journal ログ |
| メトリクス | イベントの集計を経時的に (時間経過に伴い) 記録 イベントのコンテキストは切り捨てる | Prometheus Amazon CloudWatch |
モニタリングの理想は、全イベント/コンテキストを記録することです。
しかし、それには CPU の処理性能やストレージの容量がいくらあっても足りません。
そこで上記4種類のモニタリングのように、一部のイベント/コンテキストに絞って記録します。
プロファイリングとは
プロファイリングとは、原因が特定可能なレベルで詳細なイベントのコンテキストを記録する方法です。
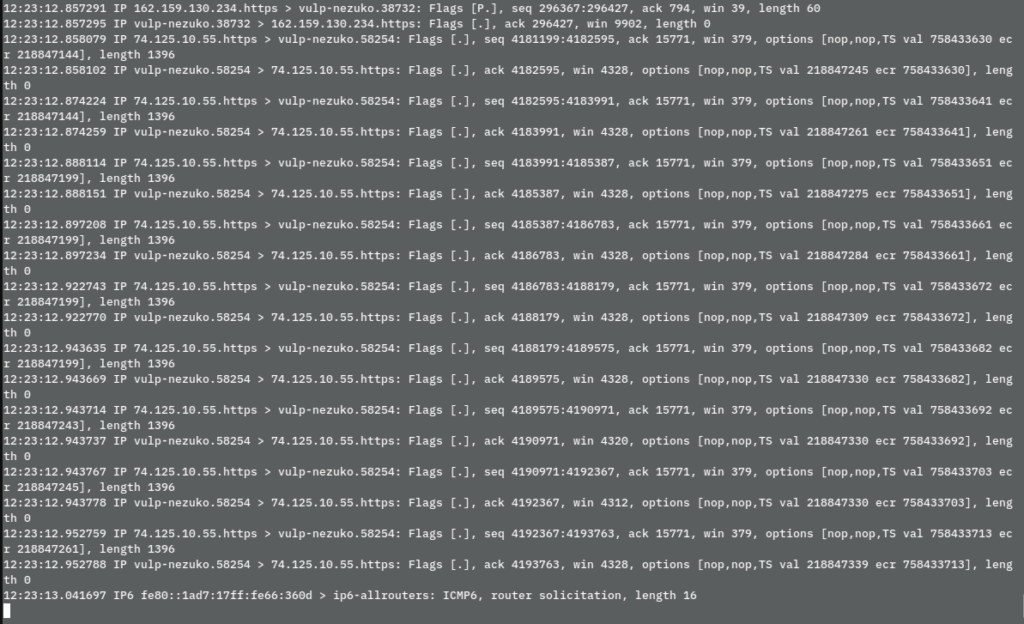
プロファイリングの一例として tcpdump があります。
プロファイリングはかなり詳細なイベントを記録可能ですが、常に記録していると CPU やディスクスペースを占有するため、本番環境で常時実行することは一般的にありません。
そのため、長期的な記録には他の種類のモニタリングを利用します。
トレーシングとは
トレーシングとは、対象とするイベントの前後のイベントの流れを記録する方法です。
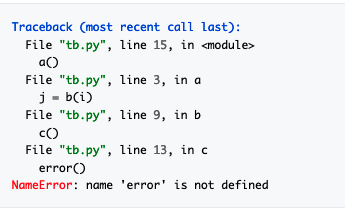
トレーシングの一例として、スタックトレースがあります。
トレーシングは、注目しているイベント以外を記録しないことで、パフォーマンスに及ぼす影響を抑えています。
一方で、注目しているイベントに対しては前後のイベントまで記録するので、どこでエラーが発生しているのか、どこで処理に時間がかかっているのかを特定できます。
ロギングとは
ロギングとは、対象とするイベントのコンテキストの一部を記録する方法です。
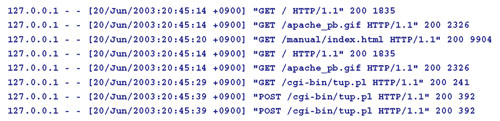
ロギングの一例として、HTTP サーバーのアクセスログがあります。
ロギングは、対象とするイベントは全て記録しますが、コンテキスト (ログのフィールド) 数を制限することで、パフォーマンスに及ぼす影響を抑えています。
そのため、対象とするイベントの詳細を確認できます。
メトリクスとは
メトリクスとは、イベントの集計を経時的に (時間経過に伴い) 記録する方法です。
イベントのコンテキストは切り捨てます。
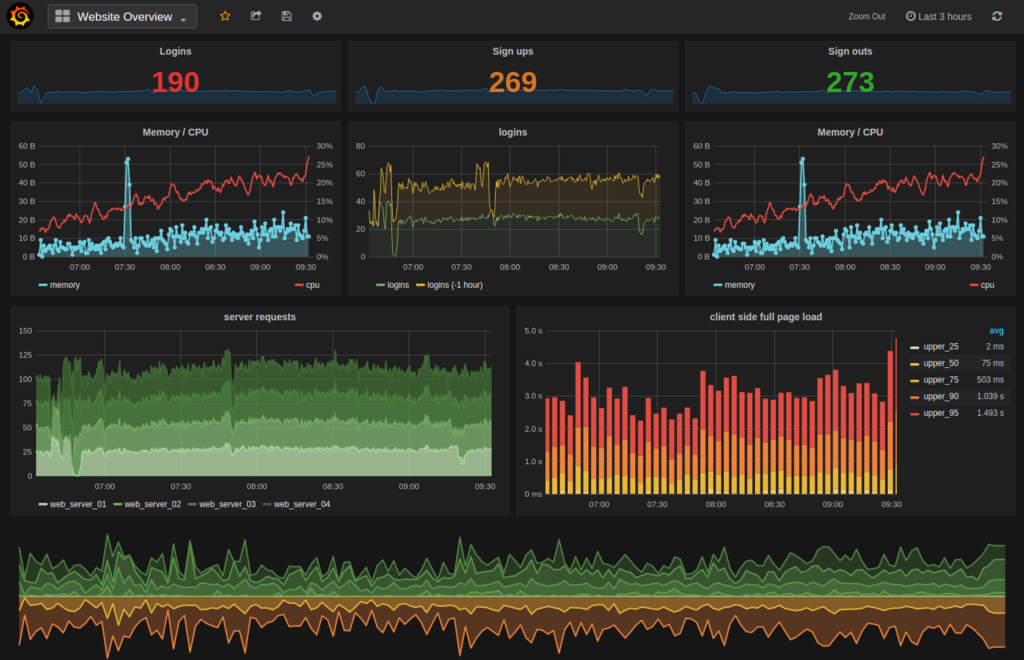
メトリクスの一例としては、Prometheus のメトリクスがあります。
(上図は Grafana で可視化してます)
メトリクスは、対象のコンテキスト以外を捨てることでパフォーマンスに及ぼす影響を抑えています。
例えば HTTP レスポンスのイベントを監視する場合は以下のようになります。
そのため、プロセス全体を見渡す時はメトリクスを利用し、詳細な原因はロギングやトレーシングを利用します。
企業事例
クックパッド
コンテナ・ミドルウェア・アプリケーションのメトリクスをモニタリングに利用

Preferred Networks
機械学習基盤 (Kubernetes クラスター・GPU) のモニタリングに利用
Yahoo
データセンターのネットワーク機器 (スイッチ・ルーター) のモニタリングに利用
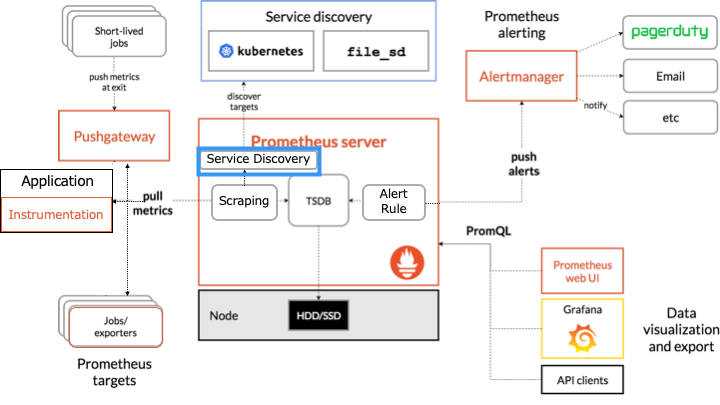
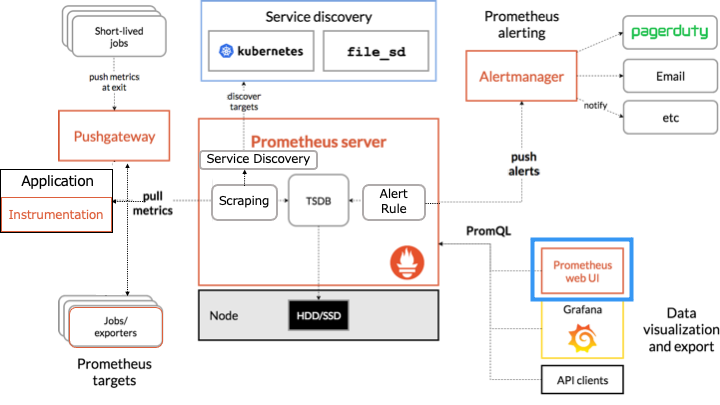
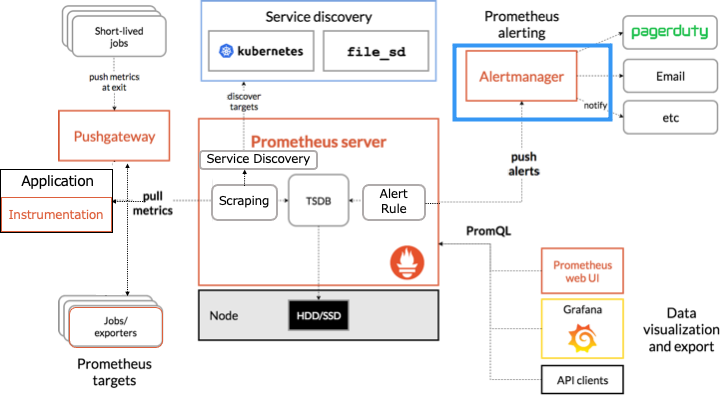
Prometheus のアーキテクチャ
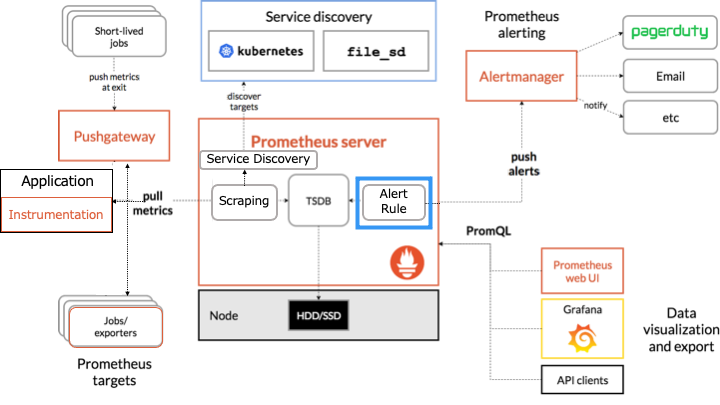
Prometheus のアーキテクチャは以下のとおりです。
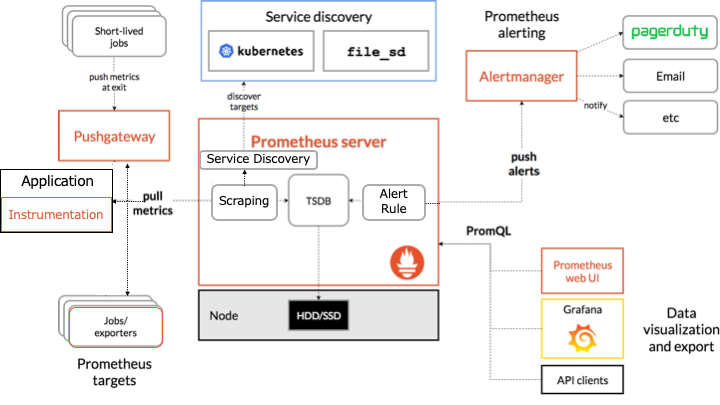
オレンジの枠で囲まれたものが Prometheus のコンポーネントです。
Prometheus は HTTP を介した pull モデルでターゲットからメトリクスを定期的に収集します。
ここからは各コンポーネントについて説明します。
インストルメンテーション (Instrumentation) とは
インストルメンテーション (Instrumentation) とは、アプリケーションにメトリクスを生成するソースコードを追加するコンポーネントです。
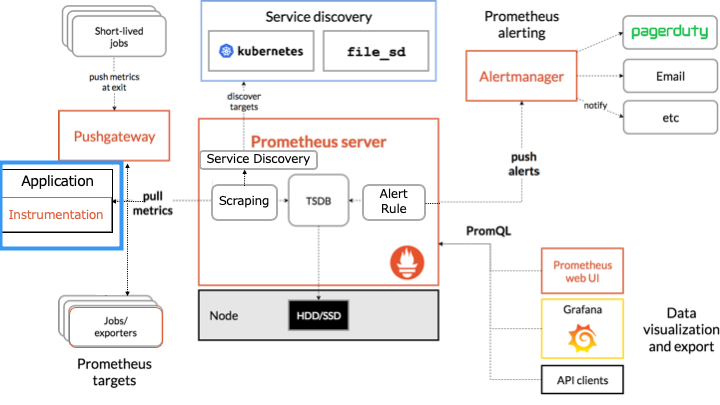
具体的には、以下のクライアントライブラリを利用して、Prometheus サーバーがアクセス可能な形式でメトリクスを開示します。

exporter とは
exporter は、Prometheus サーバーがアクセス可能な形式でメトリクスを開示するコンポーネントです。
exporter は、ソースコードにインストルメンテーションを追加できないソフトウェアのメトリクス収集に利用します。
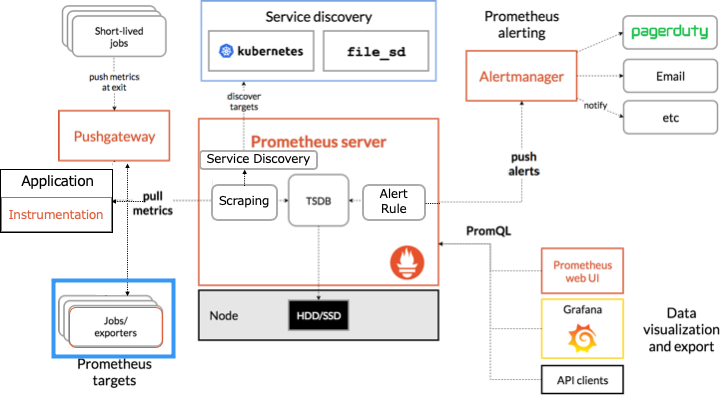
例えば、Linux カーネルのソースコードには、Prometheus のインストルメンテーションを勝手に追加できないので、exporter を利用します。
exporter には以下のようにさまざまな種類が存在します。
- Node/system metrics exporter (Linux を利用するマシンの CPU、メモリ、ディスクスペース、ディスクI/O、ネットワークの帯域幅などメトリクスを開示)
- NVIDIA GPU exporter
- PostgreSQL exporter
- Nginx metric library
- Kafka exporter
exporter の一覧は以下のドキュメントをご覧ください。

Pushgateway とは
Pushgateway は、短命すぎてメトリクスを収集できない job のための、メトリクスキャッシュです。
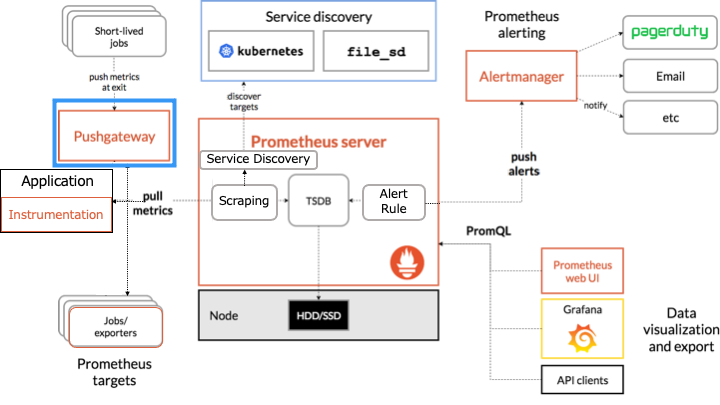
例えば、以下のような条件の場合、Prometheus サーバーは短命な job のメトリクスを収集できません。
- Prometheus サーバーの pull の間隔が 10 秒、
- 短命な job が起動してる時間は1秒
そこで、短命な job はプロセスを終了する前に、自身のメトリクスを Pushgateway に push します。
これにより、job が終了した後も Prometheus サーバーは Pushgateway からメトリクスを取得できます。
Prometheus サーバーとは
Prometheus サーバーは、主に以下の4つのコンポーネントで構成されます。
サービスディスカバリとは
サービスソフトウェアとは、exporter を実行しているマシンを探すコンポーネントです。
サービスメッシュが生まれた背景の1つとして、多くのクラウドやコンテナクラスタ環境においては、実行するサービスに割り当てられるIPアドレスを事前に知ることができないという制約の存在がある。そのため、何らかの方法を使ってサービスの稼働後にほかのサービスにアクセスするためのIPアドレスを知る必要がある(これは「サービスディスカバリ」などと呼ばれる)
https://knowledge.sakura.ad.jp/20489/
これにより、インスタンスやコンテナが障害で置き換わっても、自動で発見することができます。
スクレイピングとは
スクレイピングとは、HTTP リクエストを利用してメトリクスを収集するコンポーネントです。
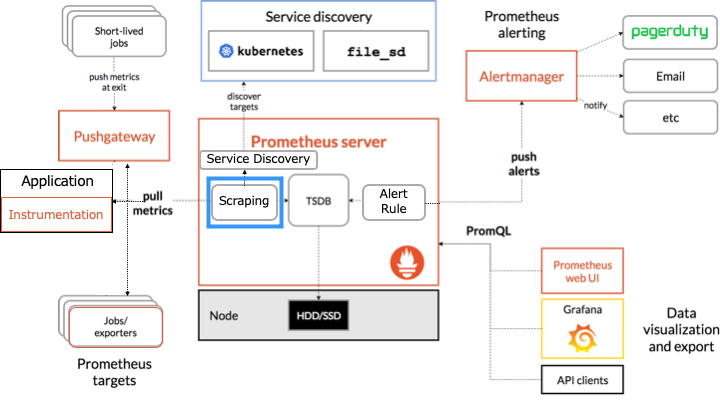
HTTP リクエストを送信しメトリクスを収集するターゲットは、インストルメンテーション、exporter、Pushgateway、サービスディスカバリです。
TSDB (time series database) とは
TSDB (time series database) とは、Prometheus が持つローカルディスク上の時系列データベースです。
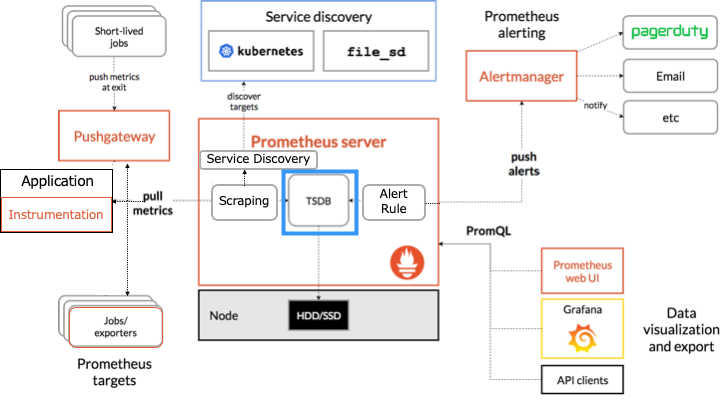
取り込んだメトリクスのサンプルは2時間のブロックにグループ化します。
Ingested samples are grouped into blocks of two hours.
https://prometheus.io/docs/prometheus/latest/storage/
アラートルールとは
アラートルールとは、Prometheus サーバーのアラートが発火するルールです。

例えば、「CPU > 90% でアラートを発火」などのルールを定義できます。
アラートルールはアラートを発火するだけで、何もしません。
Alertingmanager とは
Alertmanager は、Prometheus サーバーから受信したアラートをメールやチャットなどに送信します。

式ブラウザ Expression browser とは
式ブラウザ (expression browser) は、PromQL と呼ばれるクエリで Prometheus にあるデータを操作する Web UI です。

なお、ダッシュボードとしての役割は貧弱なので、 Grafana を利用することが推奨されてます。

Prometheus の設定と使い方
本記事では、Docker を利用して Prometheus をインストールします。
Docker については以下の記事をご覧ください。

Docker を利用して Prometheus をインストール
http://localhost:9090 へアクセスすると、式ブラウザ (expression browser) が表示されます。
(ポートフォワーディング利用時: ssh -NL 9090:localhost:9090 $REMOTE_IP)
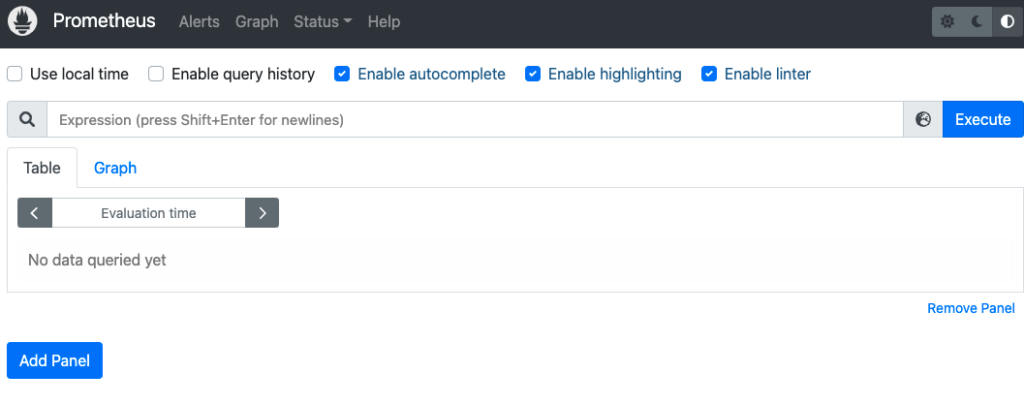
式ブラウザ (expression browser)
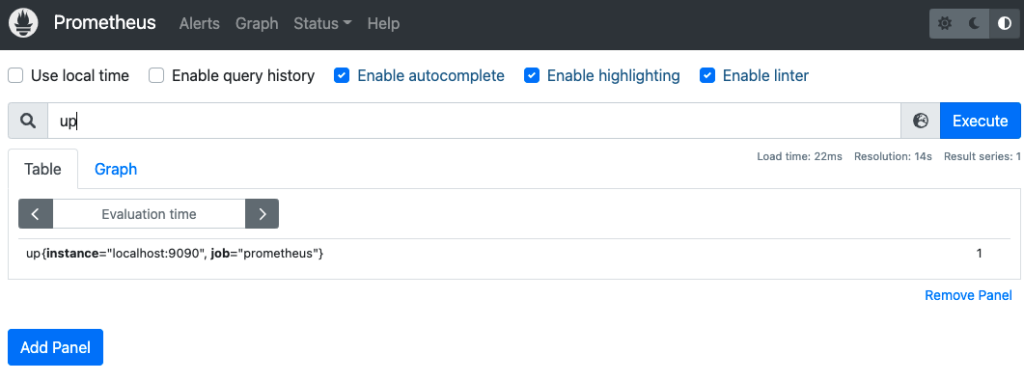
Prometheus では、デフォルトで自身のサーバーもモニタリングしているので、今回は自身のメトリクスを利用して式ブラウザの使い方を説明します。
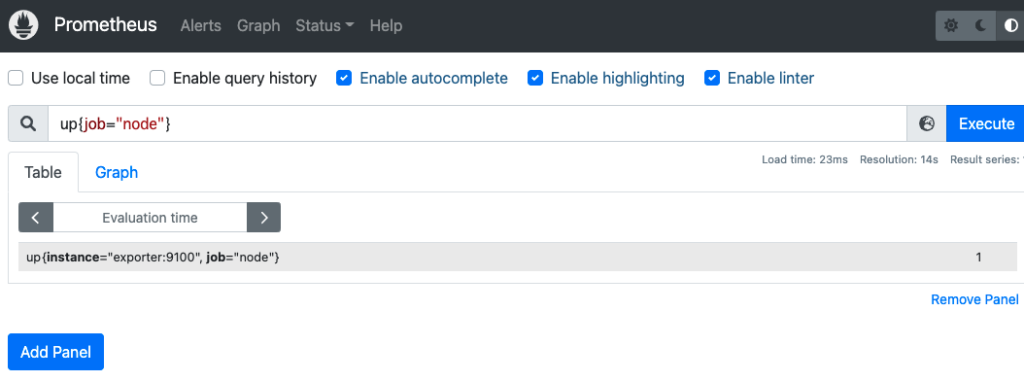
up
up メトリクスの Value はターゲットの状態を表し、1なら正常、0なら異常となります。
以下のように up という PromQL 式を入力し、Enter で実行します。
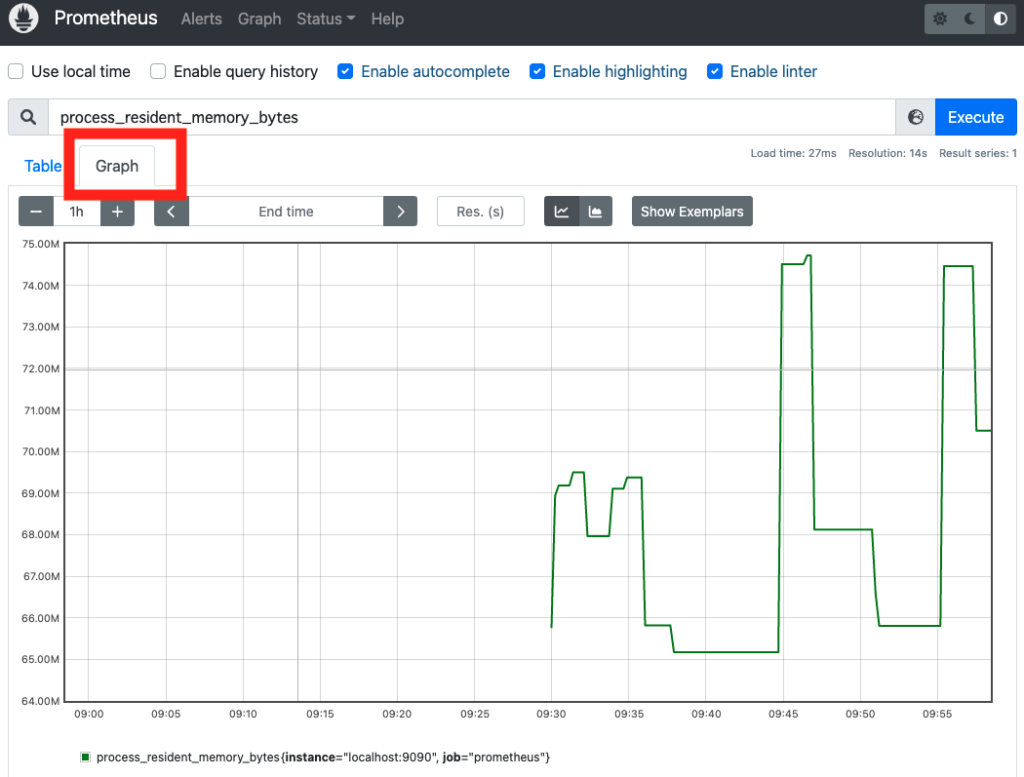
グラフを表示
Prometheus では、メトリクスをグラフで表示することが可能です。
今回は process_resident_memory_bytes メトリクス (常駐メモリサイズ) をグラフで表示します。
先ほどと同じように、process_resident_memory_bytes という PromQL 式を入力し、「Graph タブ」を押下します。
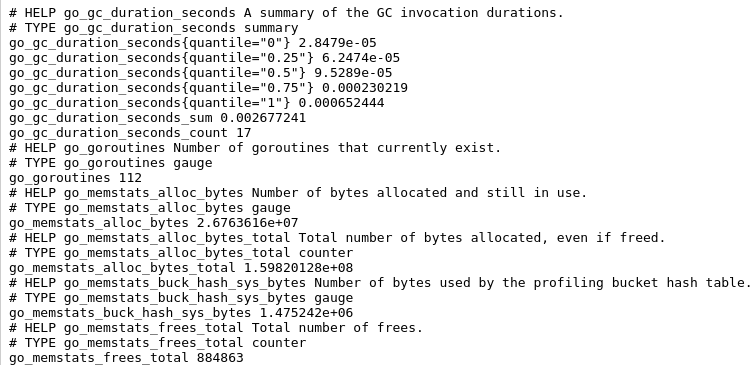
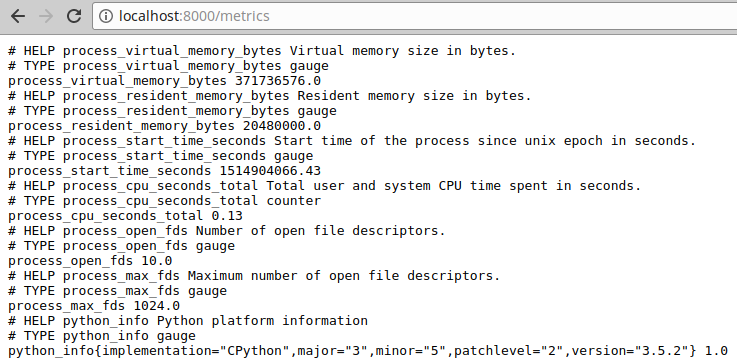
ターゲットが公開するメトリクス一覧
process_resident_memory_bytes メトリクスの他にどんなメトリクスを確認できるのでしょうか?
そんなときに、http://localhost:9090/metrics (/metrics パス) で、ターゲットが公開するメトリクス一覧を確認できます。
関数
式ブラウザでは、メトリクスの四則演算はもちろん、関数を利用して計算することも可能です。
関数一覧は公式ドキュメントをご覧ください。

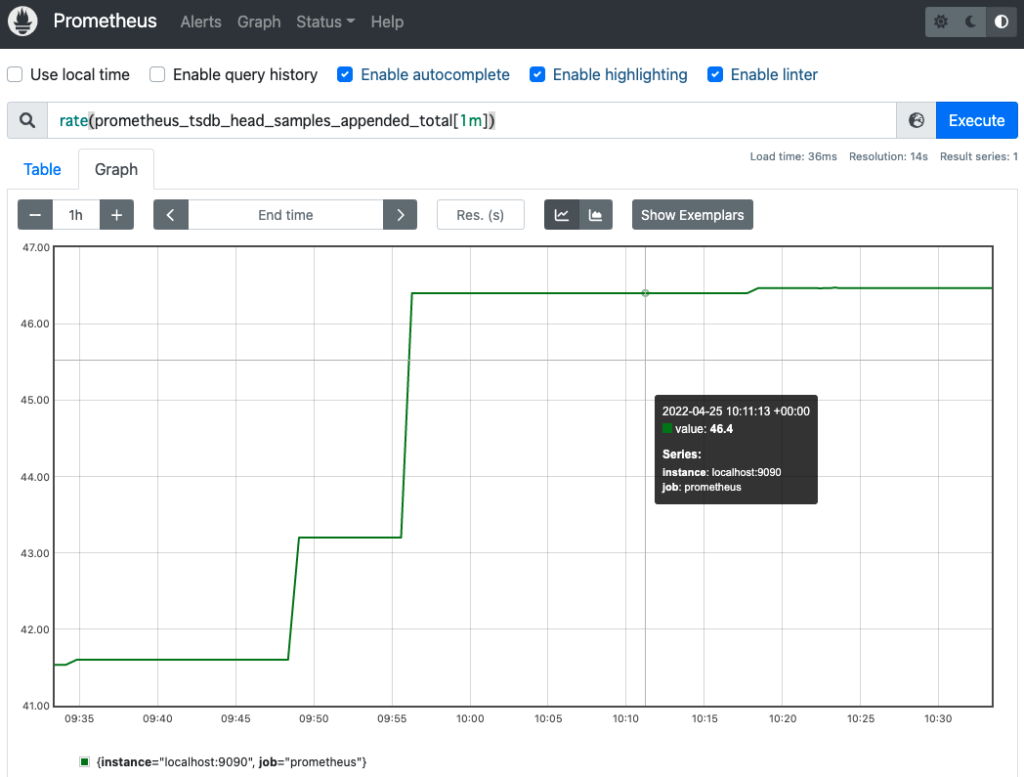
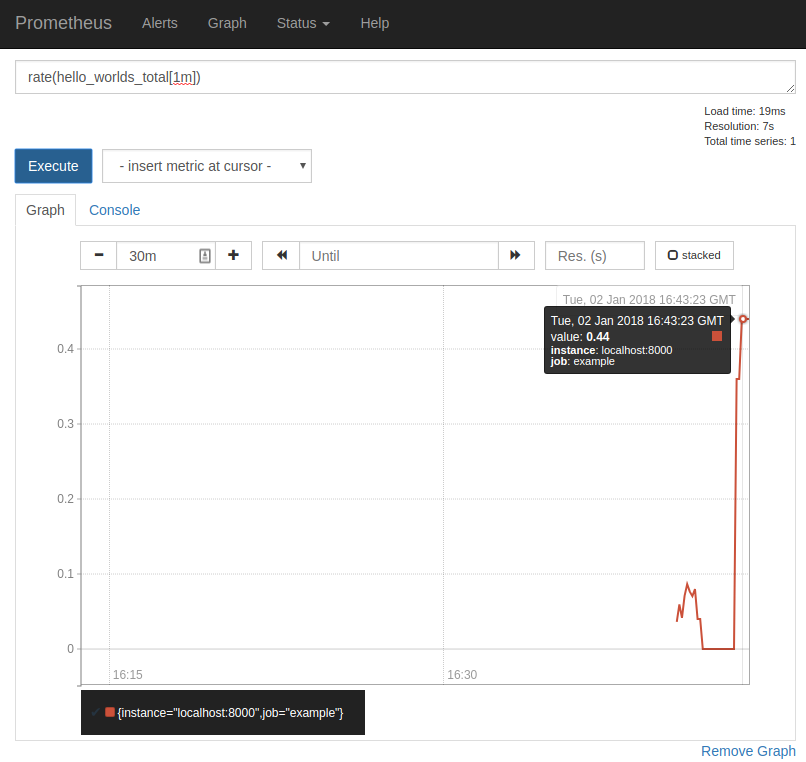
今回は、1秒あたりの平均増加率を求める rate() 関数を利用してみます。
まずは、関数を利用しない場合の prometheus_tsdb_head_samples_appended_total メトリクス (メトリクスのサンプル数の累計) を確認します。
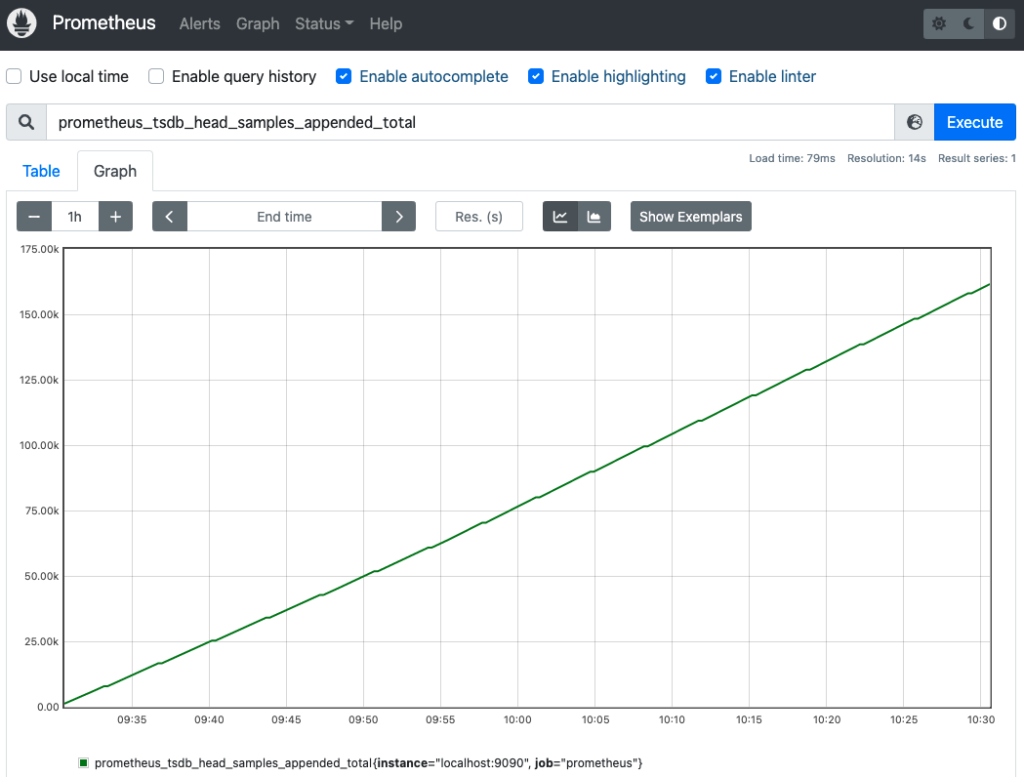
累計なので、時間と共に増加していることが確認できます。
このメトリクスの時間あたりの増加数を調査するために、rate() 関数を利用します。
exporter
今回は、Node/system metrics exporter を利用します。
(マシンの CPU、メモリ、ディスクスペース、ディスクI/O、などのメトリクスを開示する exporter)

その他の exporter は以下のドキュメントから探してください。
Node exporter をインストール
今回は、Node/system metrics exporter をインストールしたコンテナを利用して検証します。
(マシンに直接 exporter をインストール方法のほうが、exporter のイメージが湧きやすいので紹介しておきます。)
マシンに exporter をインストールする場合
version: '3'
services:
  prometheus: #Prometheus サーバー
    image: prom/prometheus
    container_name: prometheus
    volumes:
      - ./prometheus.yml:/etc/prometheus/prometheus.yml
    ports:
      - 9090:9090

  exporter: #exporter をインストールしたマシン
    image: prom/node-exporter
    container_name: exporter
    ports:
      - 9100:9100
global:
  scrape_interval: 10s
scrape_configs:
 - job_name: prometheus
   static_configs:
    - targets:
       - localhost:9090
 - job_name: node
   static_configs:
    - targets:
       - exporter:9100
Node exporter を起動
- http://localhost:9090 にアクセス
- 上部のタブにある「Status」-->「Targets」をクリック
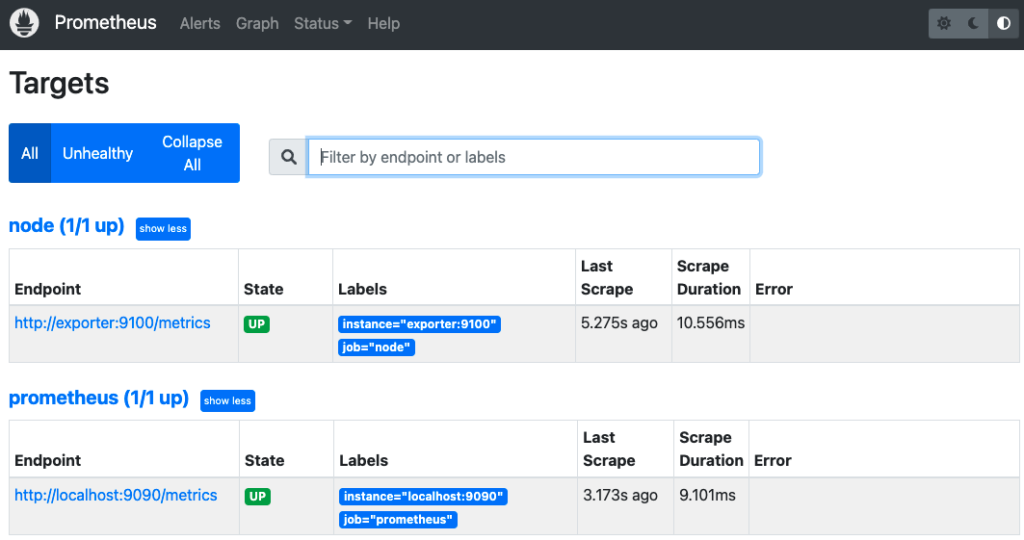
prometheus.yml で設定したコンテナが監視できていることが確認できます。
up 式で、2つのコンテナのメトリクスが取得できていることも確認できます。
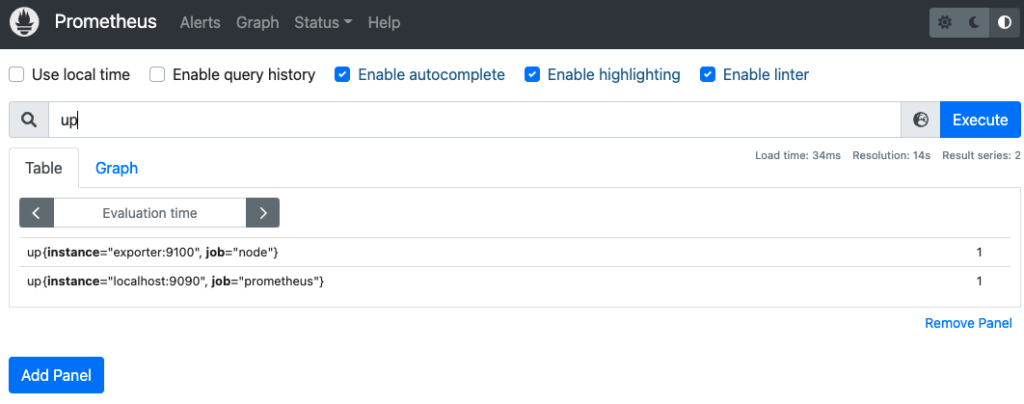
"{job="node"}" で job ラベルの値を指定すると、欲しいメトリクスだけを取得できます。
アラートルール
アラートのルールは rules.yml で設定します。
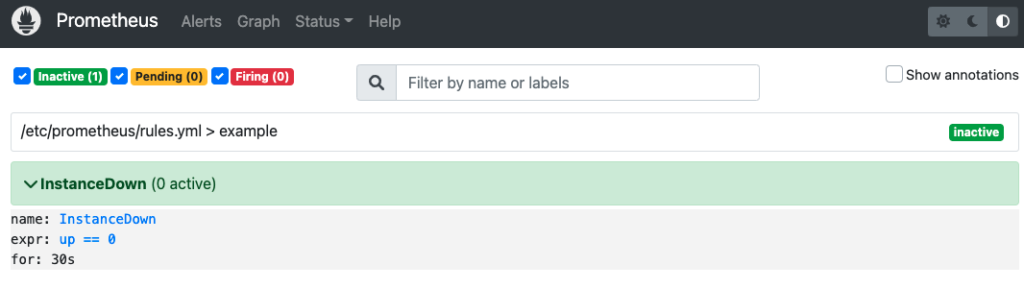
30 秒間連続で up 式のメトリクスが0を記録した (コンテナの応答がない) 場合 、InstanceDown アラートは発火するルールを定義します。
groups:
 - name: example
   rules:
   - alert: InstanceDown
     expr: up == 0
     for: 30s
prometheus.yml で rules.yml を取り込みます。
global:
  scrape_interval: 10s
  evaluation_interval: 10s
scrape_configs:
 - job_name: prometheus
   static_configs:
    - targets:
       - localhost:9090
 - job_name: node
   static_configs:
    - targets:
       - exporter:9100
rule_files:
 - rules.yml
version: '3'
services:
  prometheus:
    image: prom/prometheus
    container_name: prometheus
    volumes:
      - ./prometheus.yml:/etc/prometheus/prometheus.yml
      - ./rules.yml:/etc/prometheus/rules.yml
    ports:
      - 9090:9090
  exporter:
    image: prom/node-exporter
    container_name: exporter
    ports:
      - 9100:9100
http://localhost:9090 にアクセスし、up 式でターゲットのメトリクスがどちらも1であることを確認します。
上部のタブにある「Alerts」をクリックし、アラートを確認します。
現在up メトリクスは1なので、アラートは発火してません。
ここで、exporter コンテナを停止し、up の結果を0にします。
30 秒間 up == 0 が続いた場合、InstanceDown アラートは発火します。
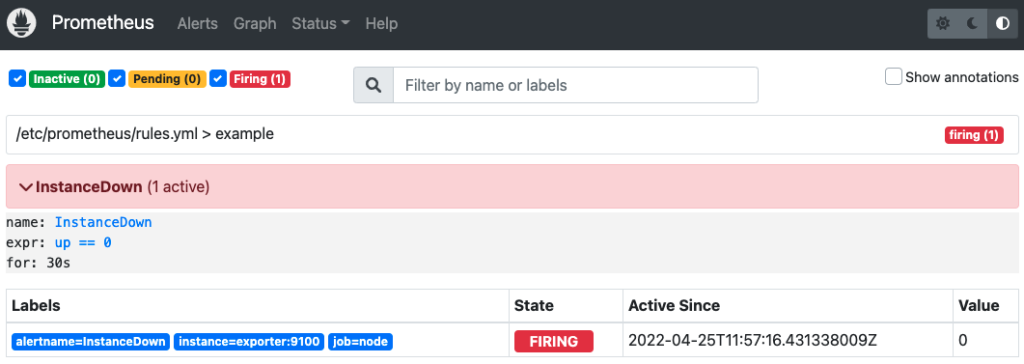
このままでは、アラートが発火するだけで何も起きないので、後述する Alertmanager を利用して発火したアラートをメールで通知します。
Alertmanager
アラートを Alertmanagers に通知するために、Prometheus サーバーの設定に設定を追加します。
global:
  scrape_interval: 10s
  evaluation_interval: 10s
scrape_configs:
 - job_name: prometheus
   static_configs:
    - targets:
       - localhost:9090
 - job_name: node
   static_configs:
    - targets:
       - exporter:9100
rule_files:
 - rules.yml
alerting:
  alertmanagers:
  - static_configs:
    - targets:
       - alertmanager:9093
docker-compose.yml に Alertmanager コンテナを追加します。
version: '3'
services:
  prometheus:
    image: prom/prometheus
    container_name: prometheus
    volumes:
      - ./prometheus.yml:/etc/prometheus/prometheus.yml
      - ./rules.yml:/etc/prometheus/rules.yml
    ports:
      - 9090:9090

  exporter:
    image: prom/node-exporter
    container_name: exporter
    ports:
      - 9100:9100

  alertmanager:
    image: prom/alertmanager
    container_name: alertmanager
    volumes:
      - ./alertmanager.yml:/etc/alertmanager/alertmanager.yml
    ports:
      - 9093:9093
Alertmanager コンテナで利用する設定ファイル (alertmanager.yml) を作成します。
global:
  smtp_smarthost: 'smtp.gmail.com:587'
  smtp_from: example@gmail.com
  smtp_auth_username: example@gmail.com
  smtp_auth_password: 'パスワード'
route:
  receiver: example-email
receivers:
 - name: example-email
   email_configs:
    - to: example@gmail.com
今回は通知先に Gmail を利用します。(赤線箇所はご自身の情報を入力してください)
- smtp_auth_username: は Gmail のメールアドレス
- smtp_auth_password: はログインパスワード or アプリパスワード (2段階認証の場合)
詳細は google のドキュメントをご覧ください。

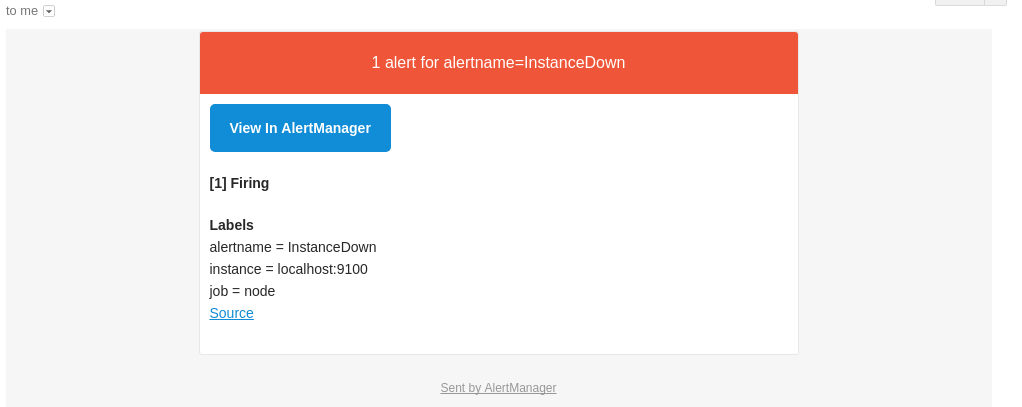
アラートが発火すると、Gmail に以下の内容のアラートが通知されます。
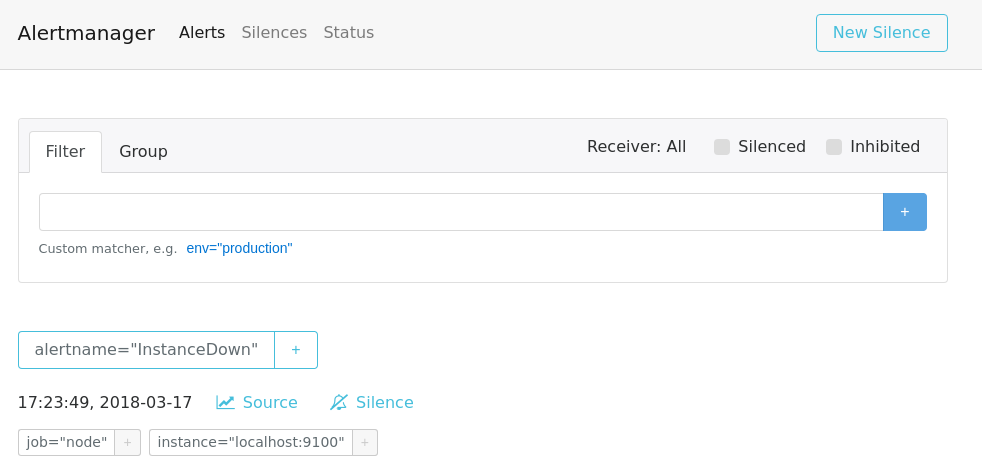
また、http://localhost:9093 にアクセスして、Alertmanager が受け取ったアラートを確認できます。
インストルメンテーション Instrumentation

今回は Python のクライアントライブラリを利用して、ソースコードにインストルメンテーションを追加します。
その他の言語のクライアントライブラリは、以下のドキュメントをご覧ください。
Hello World にインストルメンテーションを追加
import http.server
from prometheus_client import start_http_server #Prometheus のクライアントライブラリ

class MyHandler(http.server.BaseHTTPRequestHandler):
    def do_GET(self):
        self.send_response(200)
        self.end_headers()
        self.wfile.write(b"Hello World")

if __name__ == "__main__":
    start_http_server(8000) #インストルメンテーション
    server = http.server.HTTPServer(('localhost', 8001), MyHandler)
    server.serve_forever()
- http://localhost:8000 にアクセスすると、インストルメンテーションによって開示したメトリクスが確認できる
- http://localhost:8001 にアクセスすると、Hello World が確認できる
Prometheus サーバーから Hello World のメトリクスにアクセス
hello_world.py は起動したまま、別の端末から次の操作を行います。
以下の PRIVATE_IP は、ホスト OS 側の Private IP アドレスに置き換えてください。
global:
  scrape_interval: 10s
scrape_configs:
 - job_name: example
   static_configs:
    - targets:
      - $PRIVATE_IP:8000
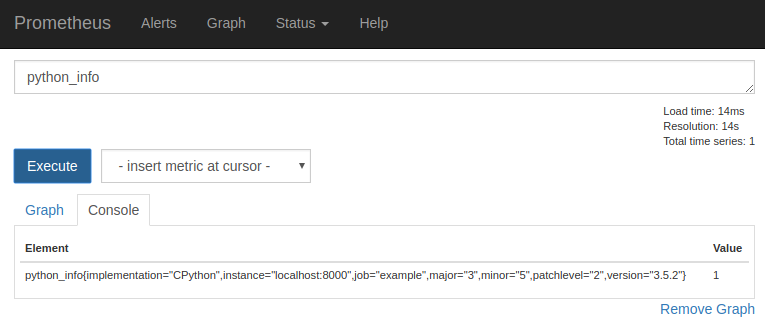
http://localhost:9090/ の式ブラウザに python_info というPromQL 式を入力します。
メトリクスタイプ
インストルメンテーションで開示するメトリクスタイプには、以下の4種類が存在します。
カウンター (counter)
カウンターは、イベントの数やサイズを追跡するために利用します。
(ソースコードの通過回数をカウントします)
import http.server
from prometheus_client import start_http_server #/metrics のクライアントライブラリ
from prometheus_client import Counter #カウンターのクライアントライブラリ

#メトリクスの定義 hello_worlds_total というカウンタ。/metrics ページの第二引数はヘルプ文字
REQUESTS = Counter('hello_worlds_total','Hello Worlds requested.')

class MyHandler(http.server.BaseHTTPRequestHandler):
    def do_GET(self):
        REQUESTS.inc() #カウンタを1増やすインストルメンテーション
        self.send_response(200)
        self.end_headers()
        self.wfile.write(b"Hello World")

if __name__ == "__main__":
    start_http_server(8000)
    server = http.server.HTTPServer(('localhost', 8001), MyHandler)
    server.serve_forever()
# HELP hello_worlds_total Hello Worlds requested.
# TYPE hello_worlds_total counter
hello_worlds_total 0.0
localhost:8001 に1度もアクセスしてないので、hello_worlds_total は0
Hello World
# HELP hello_worlds_total Hello Worlds requested.
# TYPE hello_worlds_total counter
hello_worlds_total 1.0
localhost:8001 に1回アクセスしたので、hello_worlds_total は1
もちろん、Prometheus の式ブラウザでも確認できます。
なお、REQUESTS.inc(10) のように、指定した引数でインクリメントすることも可能です。
ゲージ (guage)
ゲージとは、イベントの状態のスナップショットです。
カウンターと異なり、値をセットしたり、減少させたりすることが可能です。
import http.server
from prometheus_client import start_http_server #/metrics のクライアントライブラリ
import time
from prometheus_client import Gauge #ゲージのクライアントライブラリ

#メトリクスの定義 hello_worlds_inprogress というゲージ
INPROGRESS = Gauge('hello_worlds_inprogress','Number of Hello Worlds in progress.')
#メトリクスの定義 hello_world_last_time_seconds というゲージ
LAST = Gauge('hello_world_last_time_seconds','The last time a Hello World was served.')

class MyHandler(http.server.BaseHTTPRequestHandler):
    def do_GET(self):
        INPROGRESS.inc() # ゲージをインクリメント
        self.send_response(200)
        self.end_headers()
        self.wfile.write(b"Hello World")
        LAST.set(time.time()) #現在の UNIX 時間
        INPROGRESS.dec() #ゲージをデクリメント

if __name__ == "__main__":
    start_http_server(8000)
    server = http.server.HTTPServer(('localhost', 8001), MyHandler)
    server.serve_forever()
Hello World
# HELP hello_worlds_inprogress Number of Hello Worlds in progress.
# TYPE hello_worlds_inprogress gauge
hello_worlds_inprogress 0.0
# HELP hello_world_last_time_seconds The last time a Hello World was served.
# TYPE hello_world_last_time_seconds gauge
hello_world_last_time_seconds 1.651064662573387e+09
hello_world_last_time_seconds で、最後に hello world を表示した UNIX 時刻がわかります。
hello_worlds_inprogress は hello world 実行中なら1となります。
なお、INPROGRESS と time.time() は以下のようにゲージのユーティリティに置き換え可能です。
class MyHandler(http.server.BaseHTTPRequestHandler):
    @INPROGRESS.track_inprogress()
    def do_GET(self):
        self.send_response(200)
        self.end_headers()
        self.wfile.write(b"Hello World")
        LAST.set_to_current_time()
サマリー (summary)
サマリーとは、イベントの観測値の総数と合計と分位数を追跡するために利用します。
分位数 (パーセンタイル) とは
リクエストの0.95分位数が300ミリ秒とは、リクエストの95%が300ミリ秒以内に処理されていることを表します。
つまり、.inc() と .set(今回の値 + 今までの値) を同時にするイメージです。
なお、現時点では Python のクライアントライブラリは分位数を未サポートです。
import http.server
from prometheus_client import start_http_server #/metrics のクライアントライブラリ
import time
from prometheus_client import Summary # サマリーのクライアントライブラリ

# メトリクスの定義 hello_world_latency_seconds というサマリー
LATENCY = Summary('hello_world_latency_seconds','Time for a request Hello World.')

class MyHandler(http.server.BaseHTTPRequestHandler):
    def do_GET(self):
        start = time.time()
        self.send_response(200)
        self.end_headers()
        self.wfile.write(b"Hello World")
        LATENCY.observe(time.time() - start) #サマリーの観測値のインストルメント

if __name__ == "__main__":
    start_http_server(8000)
    server = http.server.HTTPServer(('localhost', 8001), MyHandler)
    server.serve_forever()
Hello World
# HELP hello_world_latency_seconds Time for a request Hello World.
# TYPE hello_world_latency_seconds summary
hello_world_latency_seconds_count 1.0
hello_world_latency_seconds_sum 0.0002741813659667969
- <メトリクスの basename>_count は observe を呼び出した回数 (Hello World の表示回数)
- <メトリクスの basename>_sum は observe の引数にセットした値の累計 (Hello World の表示に掛かった時間)
そのため、http://localhost:8001 にアクセスするたびに上記の値は増加します。
Hello World
# HELP hello_world_latency_seconds Time for a request Hello World.
# TYPE hello_world_latency_seconds summary
hello_world_latency_seconds_count 2.0
hello_world_latency_seconds_sum 0.0006854534149169922
ヒストグラム (histogram)
ヒストグラムとは、イベントの観測値の総数と合計と分位数を追跡するために利用します。
サマリーとヒストグラムの違いは以下のとおりです。
- サマリーは、分位数をクライアント側でストリーミング計算し、分位数を公開
- ヒストグラムは、バケット化した観測値を公開し、分位数をサーバー側で計算
以下のドキュメントに、サマリーとヒストグラムの違いが表にまとめられています。
The essential difference between summaries and histograms is that summaries calculate streaming φ-quantiles on the client side and expose them directly, while histograms expose bucketed observation counts and the calculation of quantiles from the buckets of a histogram happens on the server side using the
https://prometheus.io/docs/practices/histograms/#quantileshistogram_quantile()function.
分位数 (パーセンタイル) とは
リクエストの0.95分位数が300ミリ秒とは、リクエストの95%が300ミリ秒以内に処理されていることを表します。
import http.server
from prometheus_client import start_http_server #/metrics のクライアントライブラリ
from prometheus_client import Histogram #ヒストグラムのクライアントライブラリ

# メトリクスの定義 hello_world_latency_seconds というヒストグラム
LATENCY = Histogram('hello_world_latency_seconds','Time for a request Hello World.')

class MyHandler(http.server.BaseHTTPRequestHandler):
    @LATENCY.time() #ヒストグラムの time 関数デコーダでインストルメンテーション
    def do_GET(self):
        self.send_response(200)
        self.end_headers()
        self.wfile.write(b"Hello World")

if __name__ == "__main__":
    start_http_server(8000)
    server = http.server.HTTPServer(('localhost', 8001), MyHandler)
    server.serve_forever()
# HELP hello_world_latency_seconds Time for a request Hello World.
# TYPE hello_world_latency_seconds histogram
hello_world_latency_seconds_bucket{le="0.005"} 1.0
hello_world_latency_seconds_bucket{le="0.01"} 1.0
hello_world_latency_seconds_bucket{le="0.025"} 1.0
hello_world_latency_seconds_bucket{le="0.05"} 1.0
hello_world_latency_seconds_bucket{le="0.075"} 1.0
hello_world_latency_seconds_bucket{le="0.1"} 1.0
hello_world_latency_seconds_bucket{le="0.25"} 1.0
hello_world_latency_seconds_bucket{le="0.5"} 1.0
hello_world_latency_seconds_bucket{le="0.75"} 1.0
hello_world_latency_seconds_bucket{le="1.0"} 1.0
hello_world_latency_seconds_bucket{le="2.5"} 1.0
hello_world_latency_seconds_bucket{le="5.0"} 1.0
hello_world_latency_seconds_bucket{le="7.5"} 1.0
hello_world_latency_seconds_bucket{le="10.0"} 1.0
hello_world_latency_seconds_bucket{le="+Inf"} 1.0
hello_world_latency_seconds_count 1.0
hello_world_latency_seconds_sum 0.0013508869451470673
サマリーと同様に _count (総数) と _sum (合計) が表示されます。
また、分位数も表示されます。
(上記の結果は Hello World の処理が 0.005 秒以内である確率は 100% であることがわかります。)
Pushgateway

Pushgateway の書き込みの種類
| 種類 | Python のメソッド | 説明 |
|---|---|---|
| push | push_to_gateway | このジョブの既存メトリクスはすべて削除され、プッシュされたメトリクスが追加される。内部では、HTTPのPUTメソッドが使われている。 |
| pushadd | pushadd_to_gateway | このジョブの同名の既存メトリクスは、プッシュされたメトリクスによって上書きされる。名前の異なる既存メトリクスはそのまま残される。内部では、HTTPのPOSTメソッドが使われている。 |
| delete | delete_from_gateway | このジョブのメトリクスを削除する。内部では、HTTPのDELETEメソッドが使われている。 |
Pushgateway の使い方
Pushgateway コンテナを作成します。
version: '3'
services:
  prometheus:
    image: prom/prometheus:v2.35.0
    container_name: prometheus
    volumes:
      - ./prometheus.yml:/etc/prometheus/prometheus.yml
    ports:
      - 9090:9090

  push_gateway:
    image: prom/pushgateway:v1.4.2
    ports:
      - 9091:9091
Prometheus サーバーが Pushgateway をスクレイピングする設定をします。
scrape_configs:
 - job_name: pushgateway
   honor_labels: true
   static_configs:
    - targets:
      - push_gateway:9091
Pushgateway にメトリクスを push する short job を作成します。
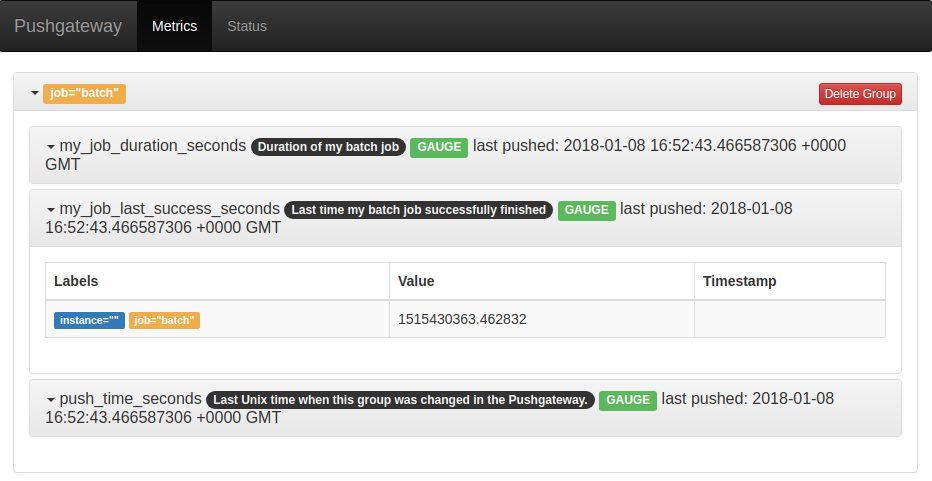
from prometheus_client import CollectorRegistry, Gauge, pushadd_to_gateway

registry = CollectorRegistry() #メトリクスを保管するレジストリ
#ゲージタイプのメトリクスを定義
duration = Gauge('my_job_duration_seconds',
        'Duration of my batch job in seconds', registry=registry)
try:
    with duration.time():# 実行時間を計測
        print('Hello World')
        pass

    # 例外が起きなかったときに限り、以下のゲージメトリクスに現在の時間をセット
    g = Gauge('my_job_last_success_seconds','Last time my batch job successfully finished',registry=registry)
    g.set_to_current_time() #
finally:
    #メトリクスを pushgateway にpushadd
    pushadd_to_gateway('localhost:9091', job='batch', registry=registry)
Hello World
http://localhost:9091/ にアクセスすると、Pushgateway に Push されたメトリクスを確認できます。
関連記事
コンテナ環境構築シリーズの記事は以下のとおりです。
参考サイト
